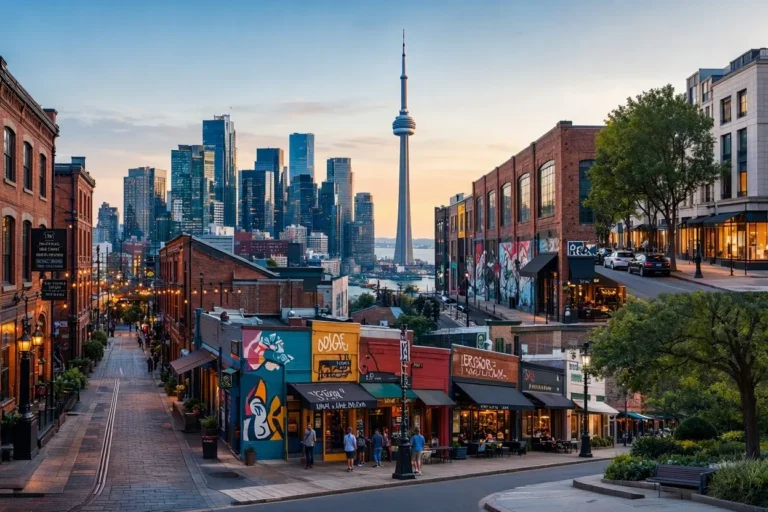
Toronto Real Estate Market Trends : Prices, Supply & Forecast
Toronto’s housing market in mid-2026 is doing something a little unusual: supply is tightening while prices stay soft. New listings dropped 17.8% year-over-year in July, but sales only slipped 1.7% over that same stretch. That gap matters. Buyers still have room to negotiate, but the room is shrinking month by month.
The Toronto Regional Real Estate Board (TRREB) tracks these shifts monthly through its MLS® system, and this year’s pattern has been consistent. Fewer sellers are listing. Prices remain below where they were last year. And the market balance is edging toward sellers without quite getting there. The average sale-to-list ratio sat at 97% in July, so most homes are still selling close to asking. That’s not a buyer’s market in the extreme sense. It’s a market in transition.
Anyone trying to make sense of Toronto real estate right now needs to watch three numbers: new listings, months of supply, and the gap between average price and benchmark price. Each one tells a different part of the story, and none of them alone gives you the full picture.
Are Toronto Home Prices Rising or Falling in 2026?
They’re falling, though the decline has slowed compared to last year. The average sale price across the Greater Toronto Area was $1,003,956 in July, down 4.5% from July 2025. Within the City of Toronto specifically, June data put the average price at $940,800, a 5.4% year-over-year drop.
The median price tells a sharper story. GTA median prices fell 5.5% year-over-year to $860,000 in July, a steeper decline than the 4.6% drop in the benchmark price. That gap usually means more lower-priced homes changed hands that month, not that every property in the city lost the same value.
Which number you look at changes the story you get. The MLS® Home Price Index benchmark softened just 0.7% month-over-month in July, a modest move next to the average price’s 5.2% monthly decline. If you’re reading headlines, check whether the report is quoting the average, median, or benchmark figure. They rarely move together, and mixing them up is an easy way to draw the wrong conclusion about where things actually stand.
How Do Prices Compare Across Property Types?
Condo apartments are holding value better than anything else in Toronto right now. GTA condo prices fell just 2.3% year-over-year to $636,323 in July, the smallest annual decline of the four major property types TRREB tracks.
Here’s how each segment performed in July 2026:
- Detached homes: averaged $1,291,690, down 5.1% year-over-year, with sales nearly flat compared to 2025.
- Semi-detached homes: averaged $964,922, down 7.3% year-over-year, the weakest result of any major type.
- Freehold townhouses: averaged $903,986, down 2.7% year-over-year, the most stable freehold segment.
- Condo apartments: averaged $636,323, down 2.3% year-over-year, with sales nearly matching last year’s volume.
Semi-detached homes are struggling the most. Sales in that segment dropped 6.5% year-over-year alongside the price decline, a combination none of the other three types are dealing with. Condos, meanwhile, are pulling buyers back in precisely because prices fell. Lower entry costs are drawing demand into a segment that spent 2023 and 2024 sitting in oversupply.
If affordability is what you’re after, condos and freehold townhouses are currently your most stable bets in this market.
Is Toronto a Buyer’s Market or a Seller’s Market?
By TRREB’s own benchmark, Toronto is a buyer’s market in 2026. An SNLR (sales-to-new-listings ratio) under 40% signals a buyer’s market, and Toronto’s came in at 39% in June, just under that line.
The City of Toronto’s ratio was actually higher than the wider GTA average: 45.0% in July, up from 36.7% a year earlier. Buyers inside city limits have less leverage than buyers looking at outer GTA municipalities, where new listings collapsed faster than sales could soak them up.
Days-on-market data backs this up. The average listing period rose to 32 days in July, up from 30 a year earlier, while average property days on market climbed to 45 from 41. Homes aren’t selling instantly, but they’re not sitting for months either.
A market tips toward sellers when new listings keep falling faster than sales, and that’s exactly the pattern GTA data has shown for three straight months now. Buyers still hold an edge today. It’s just a smaller edge than they had in early 2025.
What Is the MLS® Home Price Index Benchmark, and Why Does It Matter?
The MLS® Home Price Index tracks the value of a “typical” home in a specific neighbourhood, not a straight average of everything that sold. The Canadian Real Estate Association built the HPI specifically to strip out the distortion caused by a handful of luxury sales skewing a given month’s numbers.
Think about it this way: an average price can swing wildly if five mansions sell the same week as fifty condos. The benchmark avoids that swing by tracking a consistent set of home attributes (square footage, room count, lot size) over time. CREA reviews and updates the methodology every May to keep it aligned with how neighbourhoods are actually changing.
For Toronto, the GTA benchmark price sat at $934,600 in July 2026, down 4.6% year-over-year and 0.7% month-over-month. Compare that to the average price’s steeper 5.2% monthly drop, and the difference is obvious: benchmark prices move slower and more predictably, which is exactly why they’re the more reliable figure for tracking genuine trends rather than one noisy month.
Buyers and sellers who only look at average-price headlines risk overreacting to a single month’s numbers. The benchmark smooths that out.
How Does Toronto Compare to Other GTA Municipalities?
Toronto ranks 14th out of 23 GTA municipalities by average home price, sitting below King, Oakville, and Richmond Hill but above Mississauga, Brampton, and Ajax. Zolo’s regional ranking puts Toronto’s average price at $994,000, well under King’s $2.3 million average at the top of the list.
Price level and price growth tell different stories, though. Toronto posted a -4.3% year-over-year price change, landing 12th out of 23 for growth, squarely in the middle of the pack. King led growth at +20.3%, while New Tecumseth posted the steepest decline at -17.6%.
Toronto also ranks 9th fastest-selling among the 23 municipalities, with homes averaging 31 days on market. Markham and Ajax lead at 26 days each. On turnover (the share of new listings that convert to sales within 28 days), Toronto ranks 5th at 41.2%, ahead of larger suburban markets like Mississauga and Oakville.
These comparisons matter for a simple reason: Toronto doesn’t move in isolation from the rest of the region. A buyer priced out of the core often shifts demand toward Markham, Vaughan, or Pickering, and that spillover shows up in the ranking data every month.
What’s Driving These Trends in 2026?
Three things are shaping the market this year: mortgage rate movement, mortgage renewal pressure, and a sharp drop in new listings. Each one pulls in a slightly different direction, and together they explain why prices are falling while supply tightens at the same time.
Mortgage rates eased through 2025 and into early 2026, with the Bank of Canada holding its policy rate at 2.25%. Lower rates typically widen buyer budgets, though CMHC’s own analysis notes the full effect of a rate cut can take up to 18 months to show up in sales data. Buyers priced out a year ago are only now starting to come back.
Mortgage renewals are working against that tailwind. Homeowners who locked in ultra-low pandemic-era rates are facing materially higher payments as their terms come up for renewal in 2026, and CMHC flags this as a factor pushing some financially stretched owners to sell. That renewal wave is adding listings at the same time demand is recovering, which helps explain why prices haven’t turned upward yet despite falling rates.
New listings collapsed 17.8% year-over-year in July, the single sharpest signal in this year’s data. Sellers seem to be waiting for better pricing conditions before listing, and that’s starving the market of the supply buyers need. If that drought continues into autumn, months of supply should tighten further even without any jump in buyer demand.
Trade uncertainty tied to U.S. tariffs and the pending Canada-United States-Mexico Agreement (CUSMA) review adds a layer of caution on top of all three factors. Ontario’s export-dependent industries have shed jobs faster than the rest of the province, and that labour softness keeps some would-be buyers on the sidelines regardless of what mortgage rates are doing.
What Do Forecasts Say About Toronto Home Prices Through 2028?
CMHC forecasts Ontario home prices will keep falling in 2026 before recovering in 2027 and 2028, making Ontario the only Canadian region expected to see price declines this year. That forecast specifically calls out the GTA, citing high resale inventory and continued weak sales activity as the two forces keeping sellers under pricing pressure.
National sales are projected to rise moderately in 2026, led by Ontario and British Columbia. Both regions posted some of the weakest sales in decades and are now due for a pent-up demand rebound rather than a sustained recovery. CMHC’s baseline scenario puts the national MLS® average price at $698,000 for 2026, climbing to $705,000 in 2027 and $727,000 by 2028.
Ontario housing starts are forecast to hit near two-decade lows in 2026, driven by weak condominium pre-construction sales. Toronto specifically saw pre-construction condo sales fall to multi-decade lows in 2025, and CMHC expects many planned projects to stay delayed or cancelled through 2027.
Mortgage Sandbox takes a different approach, aggregating projections from eight lenders and real estate boards (RBC, TD, BMO, Royal LePage, and CREA among them) into a low, average, and high range rather than a single number. Their read places Metro Toronto at moderate risk of a price correction, with condo apartments carrying less bubble risk than detached houses given the gap between condo prices and local income levels.
Recovery timing hinges on two things arriving together: falling mortgage rates actually converting into sales, and new listings finally stopping their outpace of buyer demand. Neither has fully happened as of mid-2026, which is why most forecasters put meaningful price growth in 2027, not this year.
How Is the Toronto Rental Market Trending?
Rents are edging higher in 2026 after two years of decline. June’s average asking rent hit $2,543, a 1.2% month-over-month rise for the third straight month. That’s still 1.9% below year-ago levels, so renters retain some negotiating power even as the trend line turns upward.
One-bedroom units averaged $2,213 in June, down 1.9% year-over-year, while two-bedroom units averaged $2,912, also down 1.9%. Toronto ranked 5th most expensive among 60 Canadian cities tracked, behind North Vancouver, Vancouver, North York, and Kanata.
CMHC’s national outlook expects rental markets to move toward balance through 2026 as new supply outpaces demand growth, driven largely by slower immigration. Ontario specifically is expected to see vacancy rates land between 3% and 5% this year, with the highest vacancies concentrated in Southwestern Ontario and the outer Greater Golden Horseshoe, areas that leaned more heavily on non-permanent residents for population growth.
The rent-versus-buy math has shifted too. A $100,000 mortgage balance costs roughly $530.91 a month at a 4.09% five-year fixed rate, or $495.28 at a 3.40% variable rate. If you’re a renter weighing a purchase, run that math against your specific rent. The gap between owning and renting has narrowed in several Canadian markets over the past year.
Should You Buy or Sell in Toronto Right Now?
Selling favours accurate pricing from day one. Buying favours patience and pre-approval. Neither strategy rewards waiting around for a dramatic market shift, because current data doesn’t support one happening soon.
Sellers face less listing competition than a year ago, given the 17.8% drop in new listings. But the 97% average sale-to-list ratio and 32-day average listing period mean overpricing still backfires fast.
Semi-detached homes and higher-priced detached properties carry the most pricing risk for sellers this year, since those segments posted the steepest annual declines. Condo sellers face a different challenge: prices are the most stable, but competition from a large pipeline of newly completed units keeps upward pressure limited.
Buyers, on the other hand, get the most negotiating leverage in those same semi-detached and higher-priced detached segments. Pre-approval matters more than usual, since mortgage rates are expected to rise again as the Bank of Canada normalizes its policy rate later in 2026. Locking in a rate now protects against that shift over the following months.
Long-term buyers face less risk than short-term investors under current conditions. Anyone planning to hold a property for ten years or more is buying into a market near the bottom of a multi-year price cycle, according to CMHC’s 2027–2028 recovery timeline. Short-term investors face more uncertainty, since year-over-year prices remain negative and a full recovery isn’t projected before 2027 at the earliest.
Conclusion
Toronto’s 2026 market is caught between two forces: shrinking new listings and prices still working through a multi-year decline. The GTA benchmark price sits at $934,600, down 4.6% year-over-year, while new listings fell 17.8% over the same period, a combination that’s tightening supply without pushing prices back up yet. Condos are the most stable segment, semi-detached homes the weakest, and CMHC places real price recovery in 2027, not this year. Buyers still have negotiating room. Sellers who price accurately from the first day are closing deals in about 32 days on average.
FAQs

Michael Reynolds
Michael Reynolds leads ImmigrationWin’s immigration, visa, and global mobility content division. He specializes in researching immigration policies, visa requirements, application processes, and international relocation pathways for individuals, families, students, and professionals. With extensive experience analyzing immigration regulations and official government guidance, Michael brings a research-driven approach to complex immigration topics and changing visa policies. He is the primary author of ImmigrationWin’s visa guides, immigration resources, and country-specific content, helping readers better understand their options and make informed decisions about their international journey.
Related Posts