Safest Neighbourhoods in Edmonton: How to Find and Compare Them
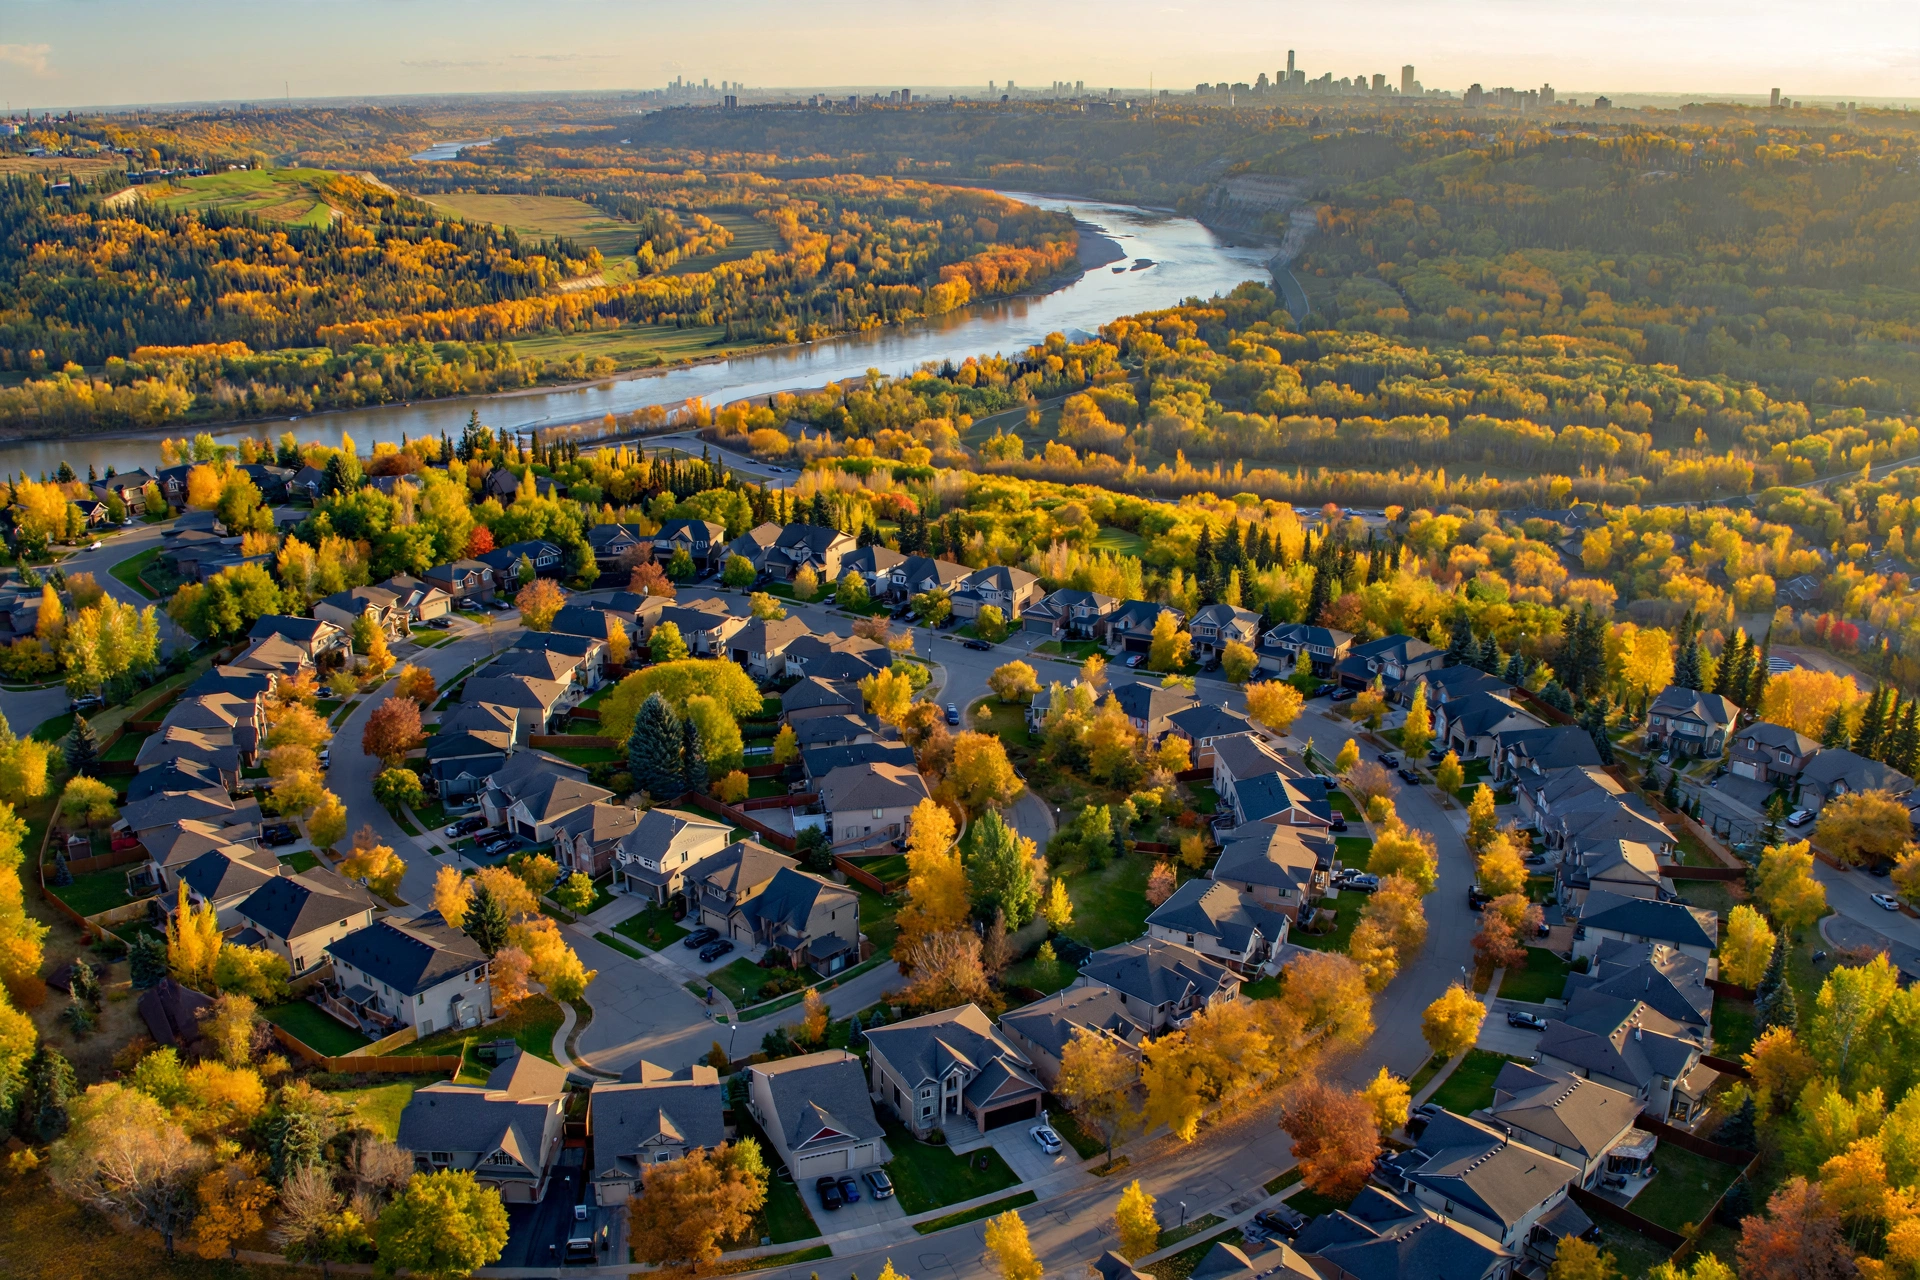
The safest neighbourhoods in Edmonton are usually quiet residential areas away from the downtown core. Windermere, Terwillegar, Riverbend, Glenora and Laurier Heights top most local shortlists. Lists date quickly, though. Check any specific address on the Edmonton Police Service (EPS) Neighbourhood Crime Map, because a published ranking can’t replace current incident data.
A safe-neighbourhood ranking is a comparison tool that scores residential areas on reported crime per resident, and buyers and renters use it to narrow their choices before they book viewings. Here’s how to use one. This guide names the areas in Edmonton to check first and shows how to verify them with official data. It also sets city neighbourhoods against the suburbs that surround Edmonton.
Key Takeaways
- The safest neighbourhoods in Edmonton are mostly low-density residential areas in the southwest and west end, such as Terwillegar, Riverbend, Glenora and Laurier Heights.
- The Edmonton Police Service Neighbourhood Crime Map shows reported incidents only inside City of Edmonton limits.
- Suburbs such as Sherwood Park, St. Albert and Spruce Grove are policed by the Royal Canadian Mounted Police (RCMP), so the EPS map doesn’t cover them.
- Statistics Canada’s Crime Severity Index (CSI) weights crimes by seriousness, so it’s a better guide to city-wide safety than raw incident counts.
- The richest neighbourhoods in Edmonton aren’t automatically the safest, because high-value homes and retail centres attract property crime.
- Compare crime per resident, not raw totals, before you decide that one neighbourhood is safer than another.
What Are the Safest Neighbourhoods in Edmonton?
The safest neighbourhoods in Edmonton are low-density residential areas in the southwest and west end, including Terwillegar, Riverbend, Windermere, Glenora, Laurier Heights and Crestwood. These areas consist mostly of detached homes on quiet crescents and cul-de-sacs, a pattern that generally produces fewer reported incidents than the downtown core. Verify each address on the EPS map.
Treat this shortlist as a starting point, not a ranking calculated from a fixed data pull. Crime patterns shift. Conditions can even differ between two blocks in the same neighbourhood, which is why a street-level check matters more than any list.
Southwest Edmonton Areas to Check First
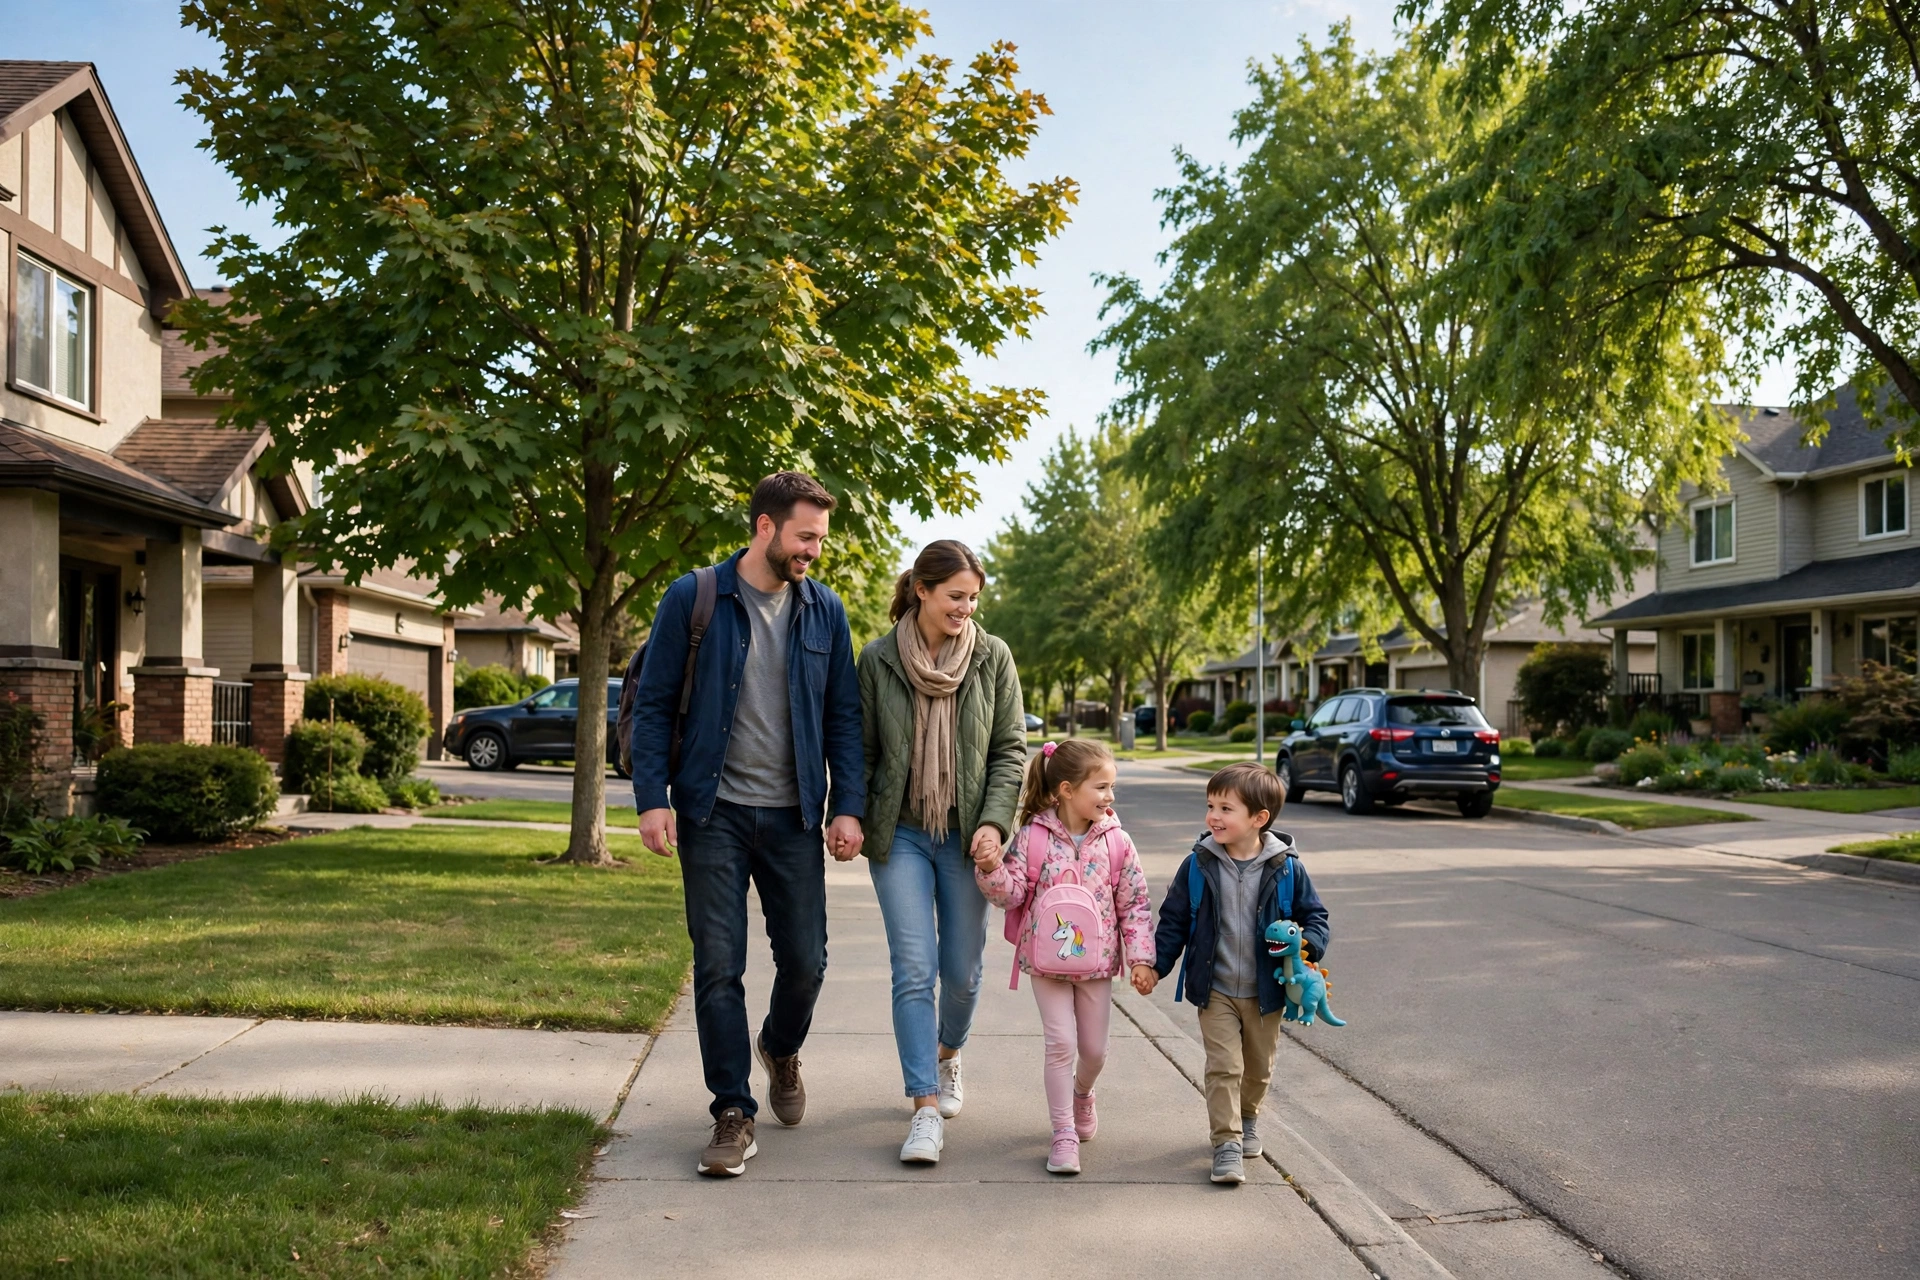
Most buyers hunting for low-crime, family-oriented streets start in southwest Edmonton. Riverbend is a natural first stop. It sits beside the North Saskatchewan River Valley, where established detached homes line streets shaded by mature trees and trails sit within easy reach.
Terwillegar, a newer family area, borders Riverbend. Its streets are built around the Terwillegar Community Recreation Centre, and residents get quick access to Anthony Henday Drive, the ring road that circles the city.
Windermere sits in the far southwest and ranks among the city’s newest upscale areas. Estate homes anchor the housing mix. Townhouses and condos are common too. The neighbourhood also has a large retail district, and since shopping areas tend to generate theft reports, check streets near the shops separately from residential pockets.
West End and River Valley Areas
Glenora, Laurier Heights, Crestwood and Parkview are mature west-end neighbourhoods close to the river valley and a short drive from downtown. Their housing stock is varied. Older bungalows and character homes sit alongside newer infill houses.
These neighbourhoods suit buyers who want an established community with large lots and quick access to the core. Traffic is the catch. Busy corridors such as Stony Plain Road run close by, so check incidents along arterial roads separately from interior streets.
Safety vs Home Price at a Glance
Benchmark prices aren’t listed. No verified current figure was available at the time of writing, so pull up-to-date prices from the REALTORS® Association of Edmonton (RAE) monthly reports before you compare. This table pairs each shortlisted neighbourhood with its area and typical home type. For prices in Alberta’s other big city, see the average house price in Calgary.
| Neighbourhood | Area | Typical Home Type | Benchmark Price (CAD) |
|---|---|---|---|
| Terwillegar | Southwest | Detached homes and townhouses | No verified figure; check RAE |
| Riverbend | Southwest | Established detached homes | No verified figure; check RAE |
| Windermere | Far southwest | Estate homes, townhouses and condos | No verified figure; check RAE |
| Glenora | West of downtown | Character and luxury detached homes | No verified figure; check RAE |
| Laurier Heights | West end | Bungalows and newer infill | No verified figure; check RAE |
| Crestwood | West end | Mature detached homes | No verified figure; check RAE |
How to Score Neighbourhood Safety Fairly
To score neighbourhood safety fairly, combine reported incidents per resident, the type and seriousness of each crime, and at least 12 months of data. One incident or one raw total misleads. Layer in housing cost and household income from official sources, too, so every safe-looking option you shortlist also fits the household budget.
Most online lists publish a ranking without ever explaining how it was built, which leaves readers unable to test the result. A transparent method fixes that. You can then rebuild the comparison yourself for any address.
Data Sources to Use
This table compares the official sources that support a neighbourhood safety comparison and what each one covers. We compare Ottawa areas the same way in our guide to the best neighbourhoods in Ottawa.
| Source | Coverage | Best Use |
|---|---|---|
| EPS Neighbourhood Crime Map | City of Edmonton only | Recent incidents by neighbourhood |
| Statistics Canada CSI | Police services and metro areas | Crime seriousness and long-term trends |
| 2021 Census of Population | All Canadian municipalities | Household income by small area |
| City of Edmonton Open Data | City of Edmonton | Neighbourhood population and boundaries |
| RAE and CREA price data | Edmonton region | Benchmark home prices by type |
The Canadian Real Estate Association (CREA) publishes the MLS® Home Price Index, a measure that tracks benchmark prices by home type. RAE covers the local side. Its monthly market statistics focus on the Edmonton region specifically, which makes them the closer fit when you’re checking prices neighbourhood by neighbourhood.
Why Per-Resident Rates Beat Raw Counts
A per-resident rate divides reported incidents by population, which removes the advantage small neighbourhoods get from simply having fewer people. The formula is simple. Use incidents ÷ residents × 1,000 = incidents per 1,000 residents.
Here’s a hypothetical example. A neighbourhood with 200 incidents and 20,000 residents has 10 incidents per 1,000 residents. Now take a smaller area with 50 incidents and 2,000 residents, and the math gives 25 incidents per 1,000 residents. The second area has fewer incidents but a higher rate.
City of Edmonton Open Data publishes population figures for each neighbourhood across several years, so you can line the counts up against your own crime data. Match the years. Use whichever population year sits closest to your crime data range.
Is Edmonton a Safe City to Live In?
Yes, Edmonton is a safe city for most residents, but its crime levels are higher than in many Canadian cities. Statistics Canada’s Crime Severity Index has placed the Edmonton census metropolitan area (CMA) above the national average in recent releases. Location shapes the picture. Most residential neighbourhoods see far fewer incidents than the downtown core and major transit hubs. Planning to rent first? See the best cities to rent in Canada.
Daily life in most Edmonton neighbourhoods carries the same risks you’d face in any large Canadian city. Property crime leads. Vehicle-related theft is common, whether thieves break into a car or drive it away, and break and enter rounds out the usual complaints.
Edmonton Crime Rate and the Crime Severity Index
The Edmonton crime rate is best measured with Statistics Canada’s Crime Severity Index, which weights each offence by its seriousness. Not every crime counts equally. A violent robbery counts for more than a minor theft, so the index reflects real harm rather than volume alone.
Statistics Canada publishes CSI values for both the Edmonton Police Service and the Edmonton CMA. No verified current figure appears here. Pull the latest value from Statistics Canada table 35-10-0026-01, and read its year-over-year change to see whether crime is rising or falling.
The index splits into two parts worth checking: the violent CSI and the non-violent CSI. Families focused on personal safety should start with the violent figure, since it tracks the offences most likely to cause physical harm. Theft-wary homeowners need the non-violent number.
How Edmonton Compares with Calgary
Calgary has posted a lower Crime Severity Index than Edmonton in recent Statistics Canada releases. The gap isn’t the whole story. Both cities contain safe residential areas alongside central districts that log more incidents, so neighbourhood choice matters in either one.
This table compares how each city publishes its crime data.
| City | Police Service | Neighbourhood Data Tool | National Comparison |
|---|---|---|---|
| Edmonton | Edmonton Police Service | EPS Neighbourhood Crime Map | Statistics Canada CSI |
| Calgary | Calgary Police Service | Calgary Police community crime statistics | Statistics Canada CSI |
Use Statistics Canada data when comparing the two cities. Local tools differ. Each police service builds and presents its own neighbourhood maps differently, so a side-by-side read of those tools can mislead.
How Do I Check Crime in an Edmonton Neighbourhood?
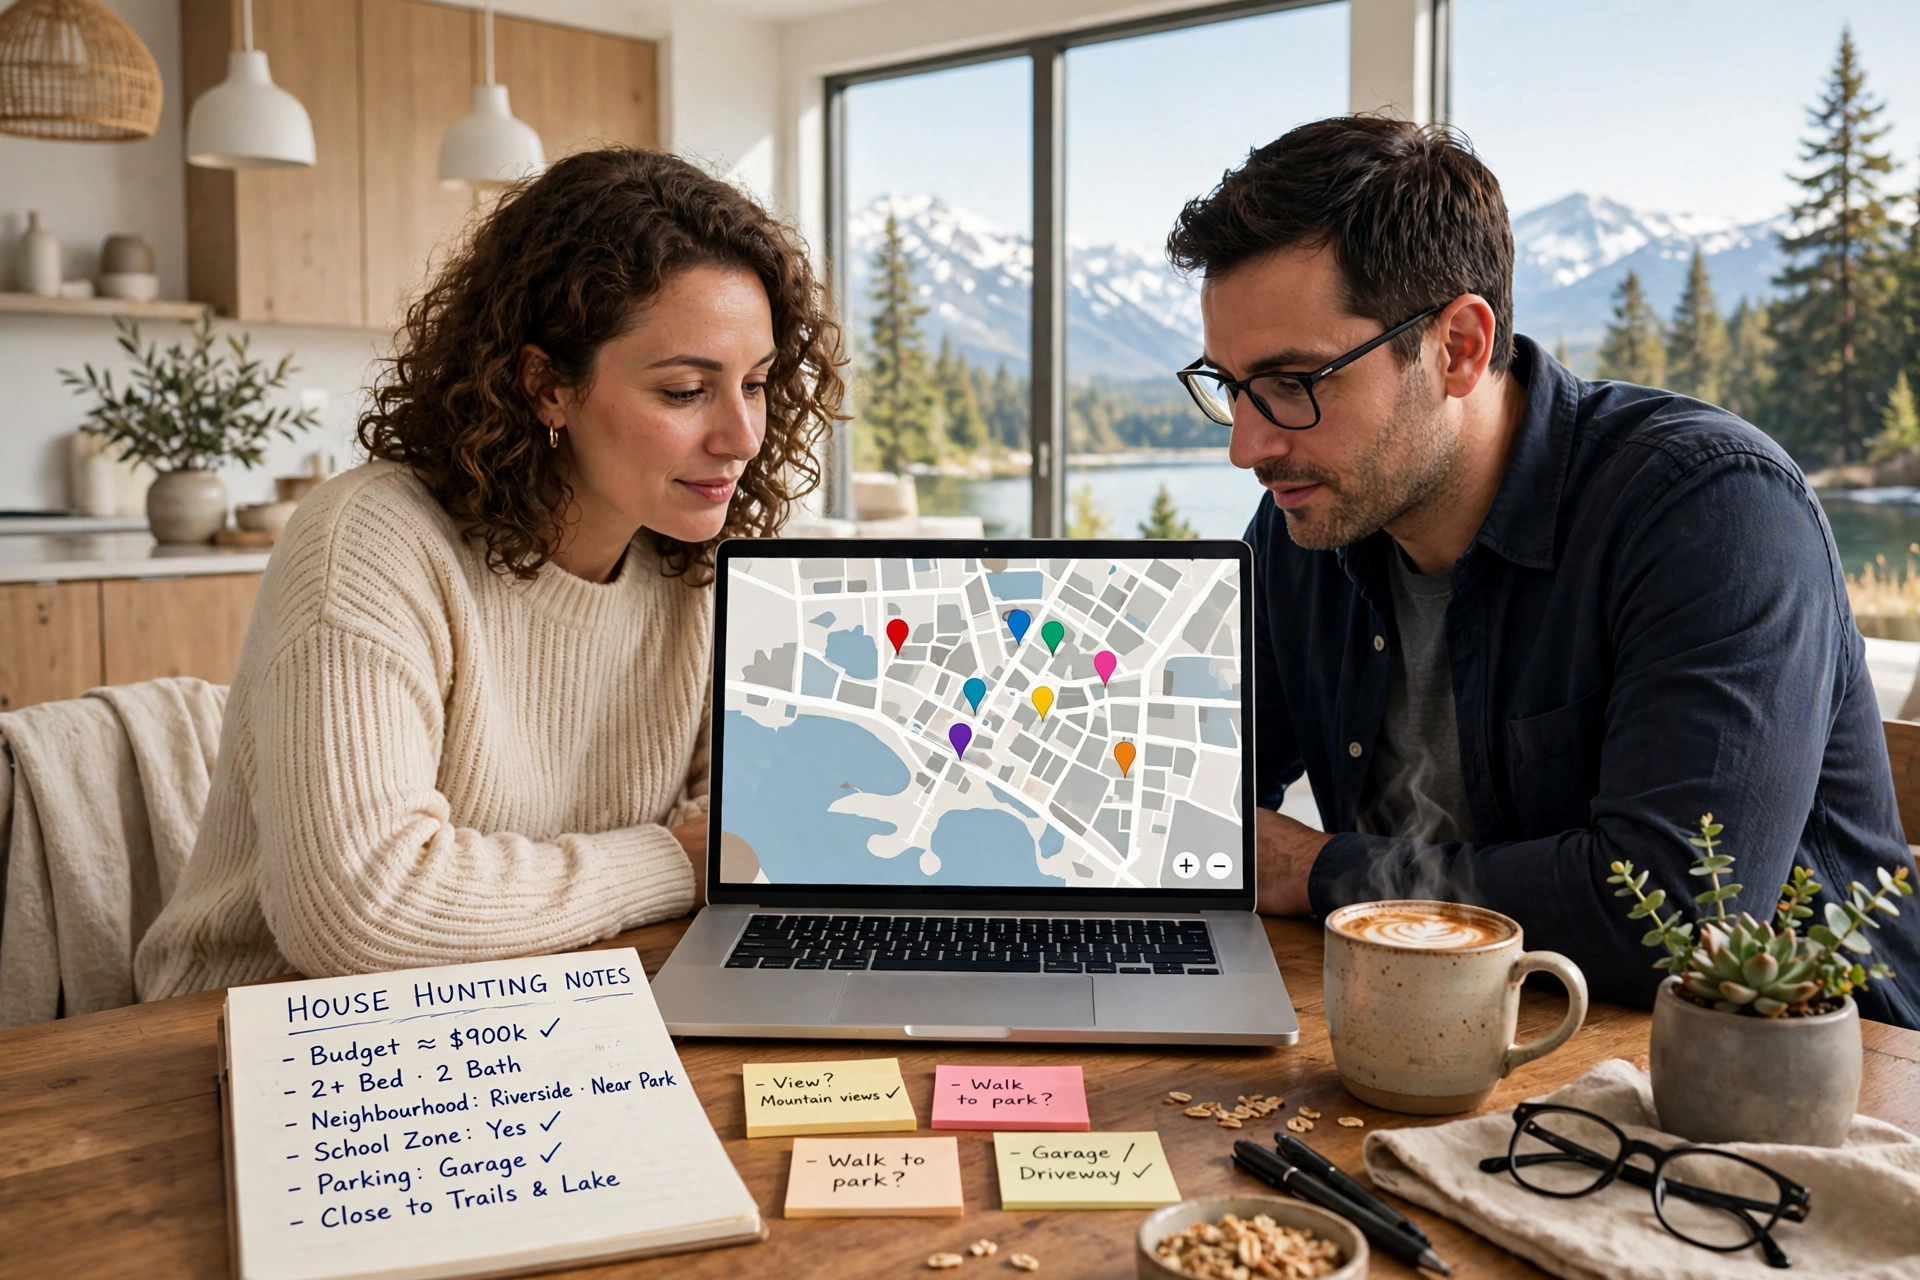
To check crime in an Edmonton neighbourhood, use the Edmonton Police Service Neighbourhood Crime Map on the EPS website. Search the address, then set the date range to at least 12 months. Filter by crime type. Finally, compare the results with neighbourhood population figures from City of Edmonton Open Data to get a fair per-resident rate.
The Edmonton crime map is the most direct way to verify any shortlist, including the one in this guide, before you commit to a viewing. It has one limit. Coverage stops at City of Edmonton limits.
Steps to Use the EPS Crime Map
- Open the Edmonton Police Service website and find the Neighbourhood Crime Map.
- Enter the street address or select the neighbourhood by name.
- Set the date range to at least 12 months to smooth out seasonal swings.
- Filter by crime types such as break and enter, theft from vehicle, theft of vehicle, robbery and assault.
- Record the total incidents for each crime type you care about.
- Download the neighbourhood population from City of Edmonton Open Data.
- Divide incidents by population and multiply by 1,000 to get a per-resident rate.
- Repeat the process for two or three alternative neighbourhoods.
- Visit each shortlisted street on a weekday evening and a weekend night.
Mistakes to Avoid When Reading the Map
Raw incident dots exaggerate risk in busy commercial areas and understate it in small residential pockets where few people live. Always convert totals into a per-resident rate.
Map locations are approximate. The markers show a general position rather than an exact address, so don’t judge a single house by one nearby dot on the screen.
Short date ranges mislead buyers. A single month can show a cluster from one event, while 12 months reveals the real pattern.
Busy edges skew the count. Arterial roads and malls push incident numbers up along neighbourhood boundaries, and LRT stations do the same. Focus instead on the interior streets where the home actually sits, roughly within 500 m (about 0.3 mi) of the address you’re considering.
Edmonton winters bring long, dark evenings. Visit after sunset in the colder months so you can judge street lighting and foot traffic for yourself rather than relying on a daytime impression.
What Are the Richest Neighbourhoods in Edmonton?
The richest neighbourhoods in Edmonton include Glenora, Windermere, Crestwood, Westbrook Estates, Wolf Willow, Windsor Park and Belgravia, based on their reputation for high-value homes. These neighbourhoods cluster near the North Saskatchewan River Valley, golf courses or the University of Alberta. Reputation isn’t proof. Confirm household income with Statistics Canada 2021 Census data.
This table compares the richest neighbourhoods in Edmonton by location and main appeal.
| Neighbourhood | Area | Known For |
|---|---|---|
| Glenora | West of downtown | River valley views and character homes |
| Windermere | Far southwest | Newer estate homes and retail access |
| Crestwood | West end | Mature lots near the river valley |
| Westbrook Estates | Southwest | Golf course setting and large lots |
| Wolf Willow | West end | Ravine and river valley proximity |
| Windsor Park | South of river | Large homes next to the University of Alberta |
| Belgravia | South of river | Mature streets near the university |
Statistics Canada’s 2021 Census Profile reports median household income by census tract and dissemination area. Boundaries won’t line up perfectly. These small geographic units don’t match City of Edmonton neighbourhood boundaries exactly, so compare the tracts that overlap each neighbourhood you’re considering.
Are Wealthy Areas Also the Safest?
No, wealthy areas are not automatically the safest neighbourhoods in Edmonton. High-value homes and luxury vehicles draw break and enter and vehicle theft, and nearby retail centres add to it. Violent crime is another matter. Many affluent areas still record low violent crime, so check property crime and violent crime separately on the EPS map before you assume that income equals safety.
A modest family neighbourhood in the southwest can record fewer property crimes than an upscale area next to a busy shopping district. Priorities decide it. The safest choice depends on the crime types that matter most to your household.
What Are the Best Suburbs of Edmonton for Families?
The best suburbs of Edmonton for families are Sherwood Park, St. Albert, Spruce Grove and Beaumont, which offer newer schools, parks and detached homes within commuting distance of the city. All four are policed by the Royal Canadian Mounted Police (RCMP). That rules out the EPS map. Compare their safety with Statistics Canada CSI data instead.
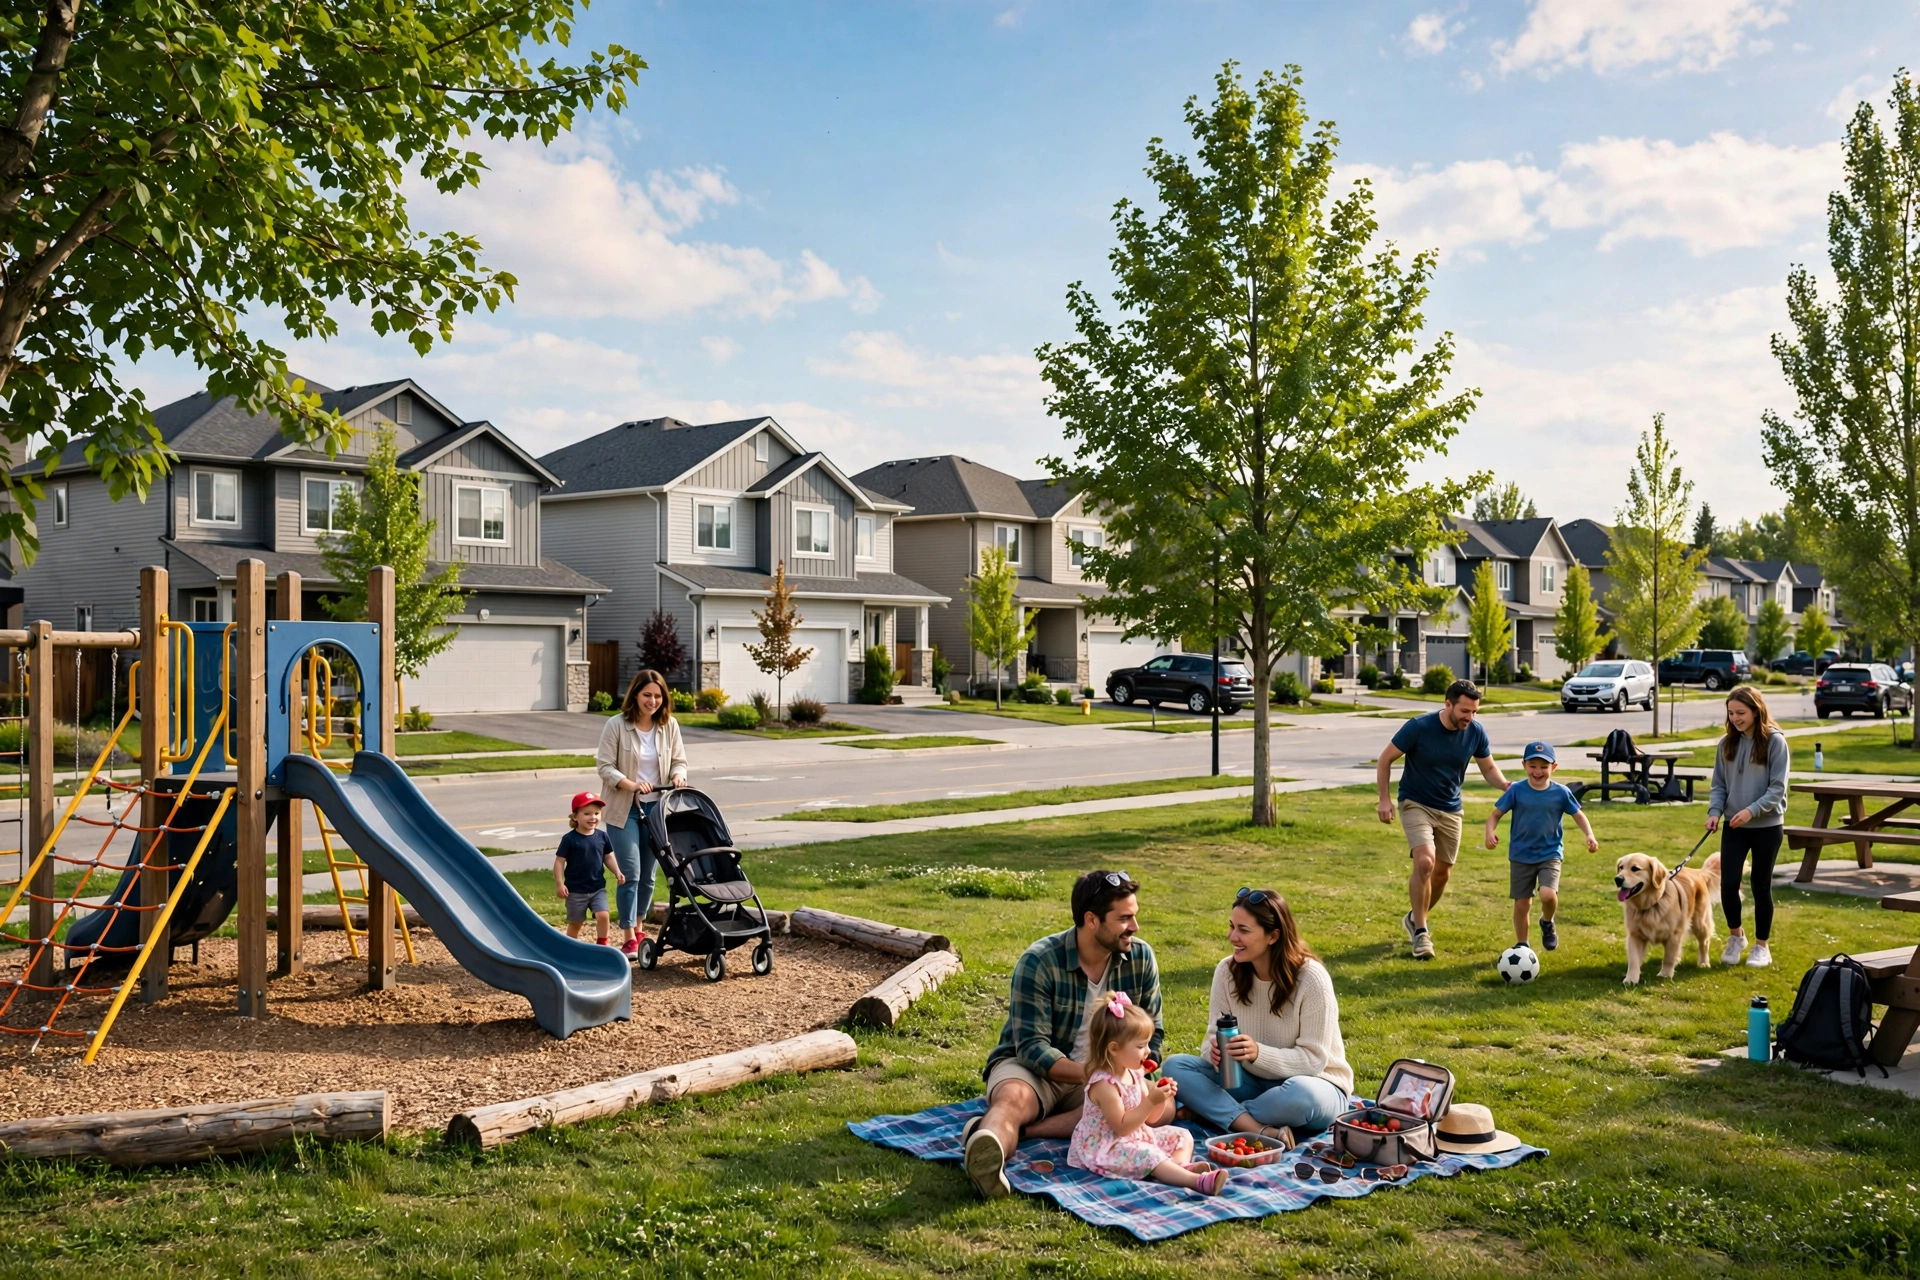
The suburbs of Edmonton appeal to families who want more space and newer housing, often with their own municipal recreation facilities close to home. There’s a trade-off. Commuters swap that space for longer drives, so test the route during morning rush hour before buying.
Edmonton Suburbs Compared
This table compares the main suburbs of Edmonton by municipality, police service and direction from the city.
| Suburb | Municipality | Police Service | Direction from Edmonton |
|---|---|---|---|
| Sherwood Park | Strathcona County | RCMP | East |
| St. Albert | City of St. Albert | RCMP | Northwest |
| Spruce Grove | City of Spruce Grove | RCMP | West |
| Stony Plain | Town of Stony Plain | RCMP | West |
| Beaumont | City of Beaumont | RCMP | South |
| Leduc | City of Leduc | RCMP | South |
| Fort Saskatchewan | City of Fort Saskatchewan | RCMP | Northeast |
Each suburb runs its own schools and recreation centres, plus other municipal services, independently of Edmonton Public Schools and Edmonton Catholic Schools. Check the address, not the town. Families should confirm which school division serves each specific property.
Is Sherwood Park Safer Than Edmonton?
No, a like-for-like neighbourhood comparison is not possible, because Sherwood Park is policed by the RCMP and is absent from the EPS crime map. A fairer test exists. That comparison sets Statistics Canada’s Crime Severity Index for the RCMP detachment serving Strathcona County against the index for the Edmonton Police Service.
Sherwood Park is an unincorporated urban community within Strathcona County, east of Edmonton. Families like its suburban layout and easy access to Anthony Henday Drive. Numbers still need checking. No verified current figure is included here, so compare the latest CSI values yourself before you weigh Sherwood Park against an Edmonton neighbourhood.
What Areas of Edmonton Should I Avoid?
No Edmonton area needs to be avoided outright, but EPS data typically shows the highest incident counts in the central core, including Downtown, Boyle Street and McCauley. These districts combine dense housing and nightlife with transit hubs and social service sites. Busy places log more reports. Buyers seeking the lowest crime usually shortlist suburban residential streets.
Conditions in the central core vary block by block. Many residents live there safely. Some buyers actively prefer central living for its walkability and transit, plus easy access to work, events and the river valley.
Entertainment districts such as Whyte Avenue in Old Strathcona can also show higher incident counts on weekend nights, a pattern that reflects visitor volume rather than only the people who live there. Context matters.
Why Downtown Shows High Crime Counts
Downtown Edmonton shows high crime counts because tens of thousands of workers, shoppers and visitors pass through an area with relatively few residents. The EPS map records incidents where they happen, not where the people involved live. Home addresses don’t factor in.
Dividing downtown incidents by the small resident population also inflates the per-resident rate, since the visitors involved in those incidents aren’t counted as residents. Treat the core as a special case. Compare it only with other high-traffic districts.
What Is the Best Place to Live in Edmonton, Alberta?
The best place to live in Edmonton, Alberta depends on priorities: Terwillegar and Riverbend suit families, Glenora and Crestwood suit established buyers, and Oliver and Garneau suit renters who want walkability. Every area trades off safety, price and commute differently. Shortlist three. Then verify each one on the EPS crime map.
This table matches common priorities with the best neighbourhoods in Edmonton to shortlist.
| Priority | Areas to Shortlist | Why |
|---|---|---|
| Family living | Terwillegar, Riverbend, St. Albert | Parks, schools and quiet residential streets |
| Established luxury | Glenora, Crestwood, Windermere | Large homes and river valley access |
| Walkable urban life | Oliver, Garneau, Old Strathcona | Shops, transit and university nearby |
| Suburban space | Sherwood Park, Spruce Grove, Beaumont | Newer detached homes and larger lots |
| Lower recorded crime | Southwest residential pockets | Mostly detached homes on quiet streets |
Readers who search for the best neighborhoods in Edmonton with US spelling will find the same areas listed here. Spelling is the only difference. City records and local listings use the Canadian spelling, “neighbourhood,” so that’s the form you’ll see on official maps and in property ads.
Best Areas for Renters vs Buyers
Renters do best in Oliver, Garneau and parts of Windermere, where apartments and condos are concentrated near transit, shops or the University of Alberta. Supply is the draw. Those neighbourhoods offer more rental supply plus shorter trips to work or class. See how Alberta compares in our guide to the real estate market by province.
Buyers looking for detached homes do best in Terwillegar, Riverbend and the suburbs, where freehold houses dominate. Investors face a different choice. They should weigh rental demand near the university and along LRT lines against the lower tenant turnover typical of family suburbs.
This table compares renting and buying across the main area types.
| Area Type | Best for Renters | Best for Buyers |
|---|---|---|
| Central core | Yes, high rental supply | Condos only; check crime map closely |
| University district | Yes, strong student demand | Older detached homes and infill |
| Southwest suburbs | Limited rental supply | Yes, detached family homes |
| Outer suburbs | Limited rental supply | Yes, newer homes and larger lots |
Conclusion
Edmonton’s neighbourhoods will keep changing as the city grows. Transit is one driver. The Valley Line West LRT extension will reshape commutes and foot traffic in the west end, which is exactly where several shortlisted neighbourhoods sit. Zoning matters too. The city’s zoning bylaw, in effect since January 1, 2024, opens more mature streets to infill housing. Meanwhile, suburbs such as St. Albert, Sherwood Park and Beaumont continue to expand as families seek more space.
The safest neighbourhoods in Edmonton today may not hold the same position in five years. Your method will still work, though. Pull 12 months of EPS crime map data and convert it to a per-resident rate, then check Statistics Canada’s Crime Severity Index for any suburb on your list. After that, pair the result with current RAE prices and visit every shortlisted street before you buy or sign a lease.
Frequently Asked Questions
Sources
- Edmonton Police Service, Neighbourhood Crime Map and crime statistics: https://www.edmontonpolice.ca
- Statistics Canada, Crime Severity Index and weighted clearance rates, police services (Table 35-10-0026-01): https://www150.statcan.gc.ca/t1/tbl1/en/tv.action?pid=3510002601
- Statistics Canada, Census Profile, 2021 Census of Population: https://www12.statcan.gc.ca/census-recensement/2021/dp-pd/prof/index.cfm?Lang=E
- City of Edmonton Open Data Portal: https://data.edmonton.ca

Johnson
Johnson leads real estate content at Civic Homes, covering home buying, selling, mortgages, renting, and market trends across Canada. He researches provincial rules, mortgage regulations, and city-by-city housing data to explain the Canadian market in plain, practical terms. His guides help buyers, sellers, renters, and investors make smarter housing decisions.
Related Posts